Posted October 12, 2025 by Ben Carlson
From the bottom in early-April the S&P 500 is up more than 32%:
The Nasdaq 100 has rallied nearly 42% from the lows.
Since the start of June, the stock market hasn’t experienced a drawdown of even 3%.
That April volatilty was intense but the market has been easy since then — up and to the right.
On Friday, the stock market fell around 3% on the day. The reason is irrelevant.
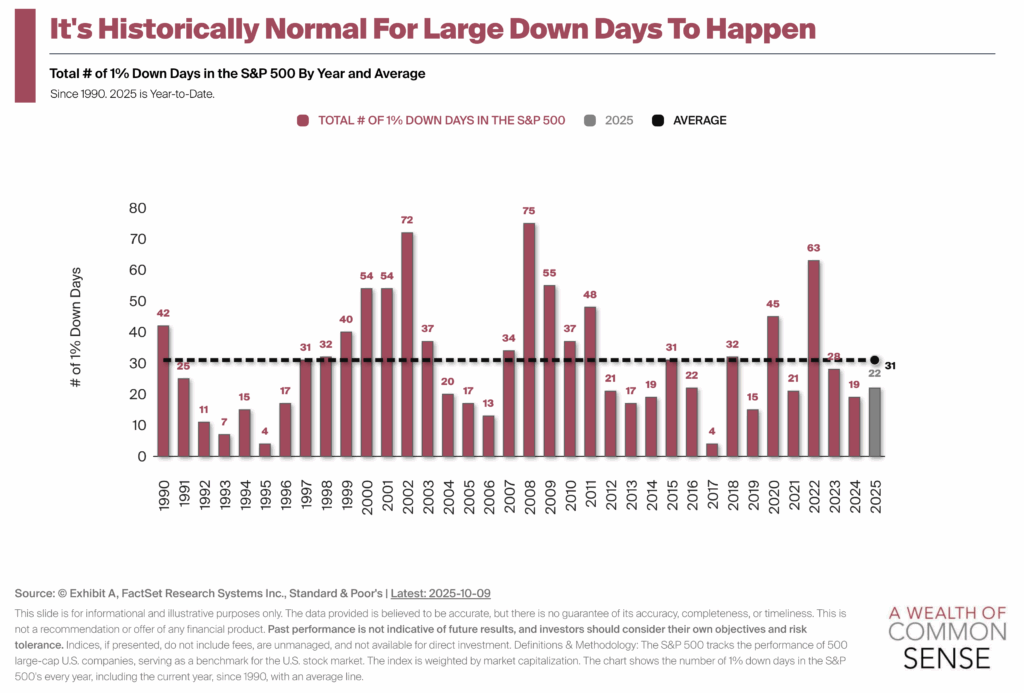
Big down days are normal, regardless of the market environment:
Even when the stock market is up there are plenty of bad days. Roughly 12% of all trading days in a given year see a loss of 1% or worse.
Since 1950, there has been a 5% correction roughly once a year, on average:
A double-digit decline has occurred once every three years or so.
If you’ve been reading this blog for a while these stats shouldn’t come as a surprise.
I find it helpful to give yourself regular reminders about how the stock market works, especially when things seem too easy.
I don’t know if this is the start of an actual correction or just a blip. Every downturn has to start somewhere but most bad days don’t turn into even worse times.
However, it’s always a good idea to have an open mind because the stock market can be so unpredictable.
The stock market goes up more often than it goes down but you have to respect the possibility of loss.
Stocks go down sometimes too.
Further Reading:
Buying When the Stock Market is Down 15%
Like these charts?
Try a free 7 day trial at Exhibit A where financial advisors can use their own logos and color schemes to create charts, presentations and decks for clients.
This content, which contains security-related opinions and/or information, is provided for informational purposes only and should not be relied upon in any manner as professional advice, or an endorsement of any practices, products or services. There can be no guarantees or assurances that the views expressed here will be applicable for any particular facts or circumstances, and should not be relied upon in any manner. You should consult your own advisers as to legal, business, tax, and other related matters concerning any investment.
The commentary in this “post” (including any related blog, podcasts, videos, and social media) reflects the personal opinions, viewpoints, and analyses of the Ritholtz Wealth Management employees providing such comments, and should not be regarded the views of Ritholtz Wealth Management LLC. or its respective affiliates or as a description of advisory services provided by Ritholtz Wealth Management or performance returns of any Ritholtz Wealth Management Investments client.
References to any securities or digital assets, or performance data, are for illustrative purposes only and do not constitute an investment recommendation or offer to provide investment advisory services. Charts and graphs provided within are for informational purposes solely and should not be relied upon when making any investment decision.
Past performance is not indicative of future results. The content speaks only as of the date indicated. Any projections, estimates, forecasts, targets, prospects, and/or opinions expressed in these materials are subject to change without notice and may differ or be contrary to opinions expressed by others.
The Compound Media, Inc., an affiliate of Ritholtz Wealth Management, receives payment from various entities for advertisements in affiliated podcasts, blogs and emails. Inclusion of such advertisements does not constitute or imply endorsement, sponsorship or recommendation thereof, or any affiliation therewith, by the Content Creator or by Ritholtz Wealth Management or any of its employees.
Investments in securities involve the risk of loss. For additional advertisement disclaimers see here: https://www.ritholtzwealth.com/advertising-disclaimers
Please see disclosures here.
Disclaimer: This story is auto-aggregated by a computer program and has not been created or edited by finopulse.
Publisher: Source link