I first heard the term ‘bagger’ in One Up on Wall Street by Peter Lynch.
He writes about Microsoft being a 100-bagger (the book came out in 1989). He mentions Dell as an 889-bagger. Subaru was a 156-bagger.
There were a lot of other baggers as well.
Lynch is credited with the term ten-bagger for a stock that’s up 10x.
There are some well-known ten-baggers during the current bull run.
Nvidia is up 10x since the spring of 2020 (crazy but true). Apple has been a ten-bagger since the fall of 2013.
If you invested in Monster Beverage in the spring of 2011, you’d be up 10x on that investment.
I am very much a buy-and-hold investor for the long-term but more so with index funds than individual stocks.
So I was curious how often ten-baggers occur in the U.S. stock market itself, not just some of the biggest individual winners.
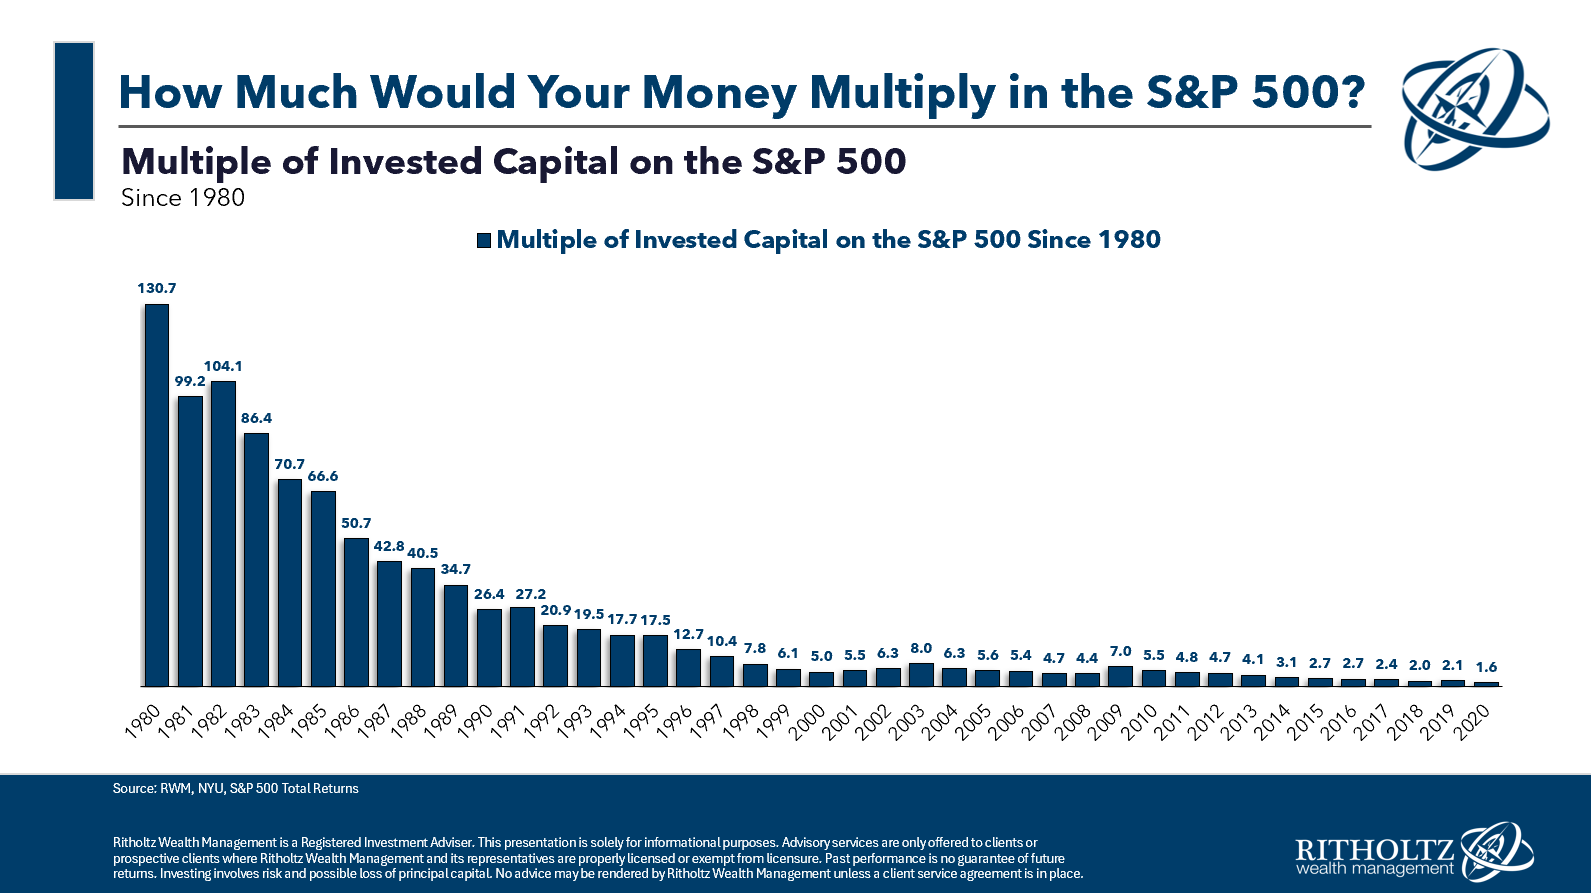
I looked back at an initial investment at the start of each year going back to 1980 through the end of 2023 to see how far back you would have to go to earn a ten-bagger on the S&P 500:
The thing that stands out the most from this chart is the fact that investors in the early-1980s would be sitting on a 100-bagger from a total return basis.1
Not just a ten-bagger but a 100-bagger!
The S&P 500 was up close to 13,000% from 1980-2023, which was good enough for annual returns of 11.7% per year during that time.
Pretty remarkable.
The most recent ten-bagger was from an initial investment in 1997. That was a 9% annual return over 27 years, which is also pretty remarkable when you consider that time frame includes two gigantic 50% crashes, two additional bear markets and three recessions to boot.
Starting in 2009 is getting close to ten-bagger status. If we wanted to cherry-pick, from the bottom of the Great Financial Crisis in March 2009, the S&P 500 is now a ten-bagger on a total return basis.
I was making purchases in my 401k throughout 2008 and 2009 but don’t think I was lucky enough to catch the absolute bottom. Still, those index fund buys back then are now approaching ten-bagger levels.
I don’t know what returns will be like from here but this is a back-of-the-envelope calculation for how long it takes to 10x your money from different annual return levels:
- 6% – 40 years
- 7% – 34 years
- 8% – 30 years
- 9% – 27 years
- 10% – 24 years
- 11% – 22 years
- 12% – 20 years
Compounding doesn’t happen overnight.
You have to be patient. If you are, a ten-bagger could be in your future, even if you don’t pick the next Apple or Nvidia.
You just have to think and act for the long-term.
Ten-baggers are for patient people.
Further Reading:
The Good & Bad of Investing in the Stock Market
1The usual caveats apply — no fees or taxes here. Just illustrating a point.
This content, which contains security-related opinions and/or information, is provided for informational purposes only and should not be relied upon in any manner as professional advice, or an endorsement of any practices, products or services. There can be no guarantees or assurances that the views expressed here will be applicable for any particular facts or circumstances, and should not be relied upon in any manner.
You should consult your own advisers as to legal, business, tax, and other related matters concerning any investment.
The commentary in this “post” (including any related blog, podcasts, videos, and social media) reflects the personal opinions, viewpoints, and analyses of the Ritholtz Wealth Management employees providing such comments, and should not be regarded the views of Ritholtz Wealth Management LLC. or its respective affiliates or as a description of advisory services provided by Ritholtz Wealth Management or performance returns of any Ritholtz Wealth Management Investments client.
References to any securities or digital assets, or performance data, are for illustrative purposes only and do not constitute an investment recommendation or offer to provide investment advisory services. Charts and graphs provided within are for informational purposes solely and should not be relied upon when making any investment decision. Past performance is not indicative of future results. The content speaks only as of the date indicated.
Any projections, estimates, forecasts, targets, prospects, and/or opinions expressed in these materials are subject to change without notice and may differ or be contrary to opinions expressed by others.
The Compound Media, Inc., an affiliate of Ritholtz Wealth Management, receives payment from various entities for advertisements in affiliated podcasts, blogs and emails. Inclusion of such advertisements does not constitute or imply endorsement, sponsorship or recommendation thereof, or any affiliation therewith, by the Content Creator or by Ritholtz Wealth Management or any of its employees. Investments in securities involve the risk of loss. For additional advertisement disclaimers see here: https://www.ritholtzwealth.com/advertising-disclaimers
Please see disclosures here.
Disclaimer: This story is auto-aggregated by a computer program and has not been created or edited by finopulse.
Publisher: Source link