Alan Greenspan’s infamous irrational exuberance speech is a classic example of how crazy markets can always get crazier.
This was the actual text from his speech at a policy dinner in December of 1996:
Clearly, sustained low inflation implies less uncertainty about the future, and lower risk premiums imply higher prices of stocks and other earning assets. We can see that in the inverse relationship exhibited by price/earnings ratios and the rate of inflation in the past. But how do we know when irrational exuberance has unduly escalated asset values, which then become subject to unexpected and prolonged contractions as they have in Japan over the past decade? And how do we factor that assessment into monetary policy? We as central bankers need not be concerned if a collapsing financial asset bubble does not threaten to impair the real economy, its production, jobs, and price stability. Indeed, the sharp stock market break of 1987 had few negative consequences for the economy.
But we should not underestimate or become complacent about the complexity of the interactions of asset markets and the economy. Thus, evaluating shifts in balance sheets generally, and in asset prices particularly, must be an integral part of the development of monetary policy.
The former Fed chair wasn’t pounding the table that the stock market was a bubble but he was certainly implying something was afoot.
From 1980 through Greenspan’s speech at the tail end of 1996, the S&P 500 was up more than 1,200% in total or a blistering 16.5% return on an annual basis. Valuations were up, up and away. The Netscape IPO occurred a year earlier.
Things felt very toppy.
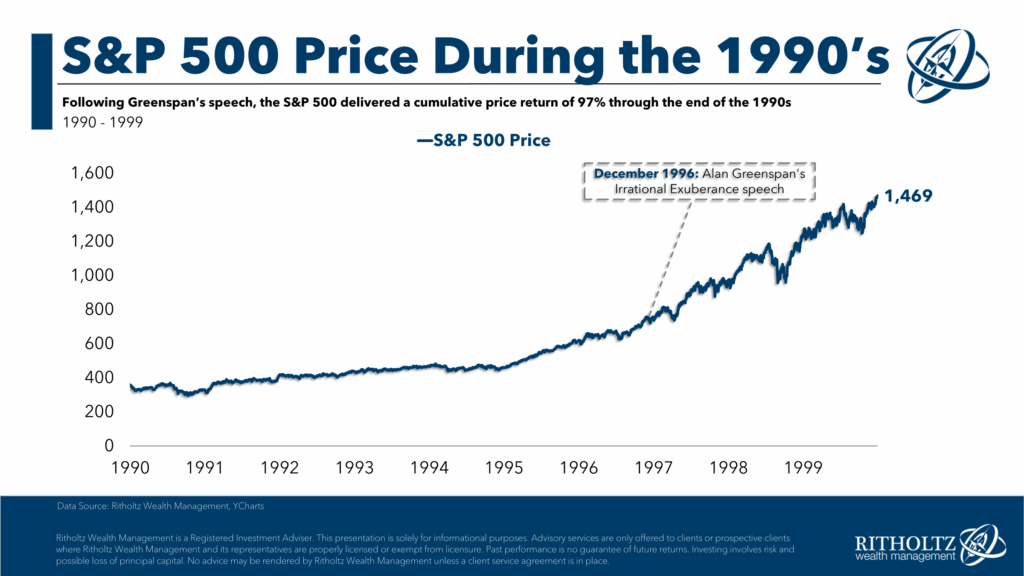
That didn’t matter. The market took off like a rocket ship following Greenspan’s speech:
From the time of Greenspan’s speech through the rest of the decade the S&P would more than double, good enough for an annualized return of nearly 26% through the end of 1999. The market was up 33% in 1997, 28% in 1998 and another 21% in 1999.1
The dot-com bubble finally burst in the spring of 2000, cutting the S&P 500 in half along with a drawdown of more than 80% in the Nasdaq.
Some people are starting to wonder if we’re in a similar situation now.
No two markets are ever the same. The companies in the dot-com bubble didn’t make any money.
They didn’t have the ridiculous profit margins tech stocks have today. But there are some similarities.
The AI capex spending binge is eerily similar to the telecomm buildout that occurred in the 1990s.
Speculative activity is all over the place too — SPACs, meme stocks, IPOs, leverage, story stocks, high valuations, deregulation, etc.
And the two bull markets have taken on a similar trajectory over time:
Many people are trying to figure out whether this is the early stages of a bubble or the end of the road.
Investing would be a lot easier if there were a simple way to predict these types of markets. Unfortunately, there’s not. No one can predict when human nature will take things too far or when it will stop on a dime.
The pendulum always swings; we just don’t know how far in either direction.
Forecasting the market in the short run is impossible.
Investing for the long run is the best remedy for the uncertainties of the short run.
If you had invested in the S&P 500 following Greenspan’s speech in December of 1996 and held on until today, you would be up just shy of 10% per year. You would have had to live through two 50% crashes in the next dozen years or so, 9/11, multiple wars, oil going to $150/barrel then negative, the pandemic, 40-year high inflation, the 2022 bear market and about a dozen other run-of-the-mill corrections.
But even after all that bad stuff you still would have more or less gotten the market’s long-term annual return.
That’s not bad.
If you had invested at the peak of the market just before the dot-com bubble burst at the end of 1999, you would be up a little more than 8% per year. That’s not a terrible outcome considering all of the bad stuff you would have had to live through plus that was the most expensive valuations the U.S. stock market has ever seen.
Obviously, no one actually invests like that (except Bob). People don’t put all of their money to work all at once.
Most people invest in 1996, 1999, 2007, 2009, 2020 and everything in-between.
One of the best features of dollar cost averaging into the market over time is that it allows you diversify across time, valuation level and market environment.
If you’re averaging into the market over time you should welcome volatility.
If you’re fully invested, you must be willing to accept volatility or diversify your assets to dampen whatever pain it may cause.
These things are far easier and more helpful than trying to predict the beginning or end of a financial asset bubble.
Further Reading:
An Epic Bull Market
1And that was following +37% in 1995 and +23% in 1996. Just an insane run.
Disclaimer: This story is auto-aggregated by a computer program and has not been created or edited by finopulse.
Publisher: Source link