I try to limit checking my portfolio to once a quarter, and this is my 2025 Q2 update that includes our combined 401k/403b/IRAs and taxable brokerage accounts but excludes our house and side portfolio of self-directed investments. Following the concept of skin in the game, the following is not a recommendation, but a sharing of our actual, imperfect DIY portfolio.
“Never ask anyone for their opinion, forecast, or recommendation. Just ask them what they have in their portfolio.” – Nassim Taleb
How I Track My Portfolio
Here’s how I track my portfolio across multiple brokers and account types:
- The Empower Personal Dashboard real-time portfolio tracking tools (free) automatically logs into my different accounts, adds up my various balances, tracks my performance, and calculates my overall asset allocation daily. Formerly known as Personal Capital.
- Once a quarter, I also update my manual Google Spreadsheet (free to copy, instructions) because it helps me calculate how much I need in each asset class to rebalance back towards my target asset allocation.
I also create a new sheet each quarter, so I have a personal archive of my net worth dating back many years.
2025 Q2 Asset Allocation and YTD Performance
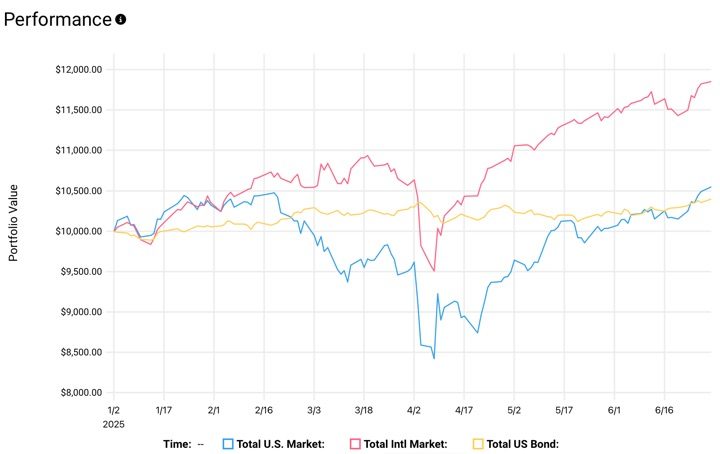
At the top of this post are updated performance and asset allocation charts, per the “Holdings” and “Allocation” tabs of my Empower Personal Dashboard.
The major components of my portfolio are broad index ETFs. I do mix it up a bit around the edges, but not very much. Here is a breakdown of my target asset allocation along with my primary ETF holding for each asset class.
- 35% US Total Market (VTI)
- 5% US Small-Cap Value (VBR/AVUV)
- 20% International Total Market (VXUS)
- 5% International Small-Cap Value (AVDV)
- 5% US Real Estate (REIT) (VNQ)
- 20% US “Regular” Treasury Bonds and FDIC-insured deposits
- 10% US Treasury Inflation-Protected Bonds
Big picture, it is 70% businesses and 30% very safe bonds/cash:
By paying minimal costs including management fees, transaction spreads, and tax drag, I am trying to essentially guarantee myself above-average net performance over time.
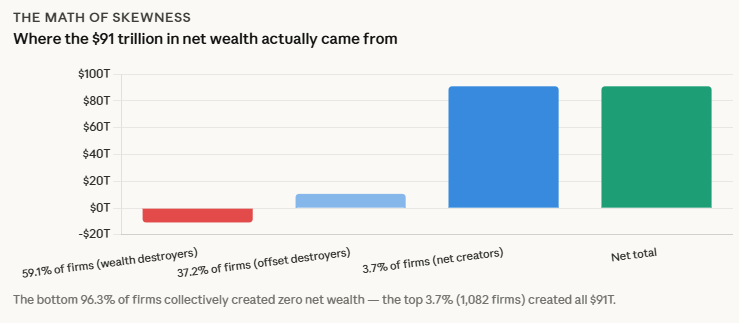
I do not spend a lot of time backtesting various model portfolios. You’ll usually find that whatever model portfolio is popular at the moment just happens to hold the asset class that has been the hottest recently.
The portfolio that you can hold onto through the tough times is the best one for you.
I’ve been pretty much holding this same portfolio for 20 years. Check out these ancient posts from 2004 and 2005. Every asset class will eventually have a low period, and you must have strong faith during these periods to earn those historically high returns. You have to keep owning and buying more stocks through the stock market crashes. You have to maintain and even buy more rental properties during a housing crunch, etc. A good sign is that if prices drop, you’ll want to buy more of that asset instead of less. I don’t have strong faith in the long-term results of commodities, gold, or bitcoin – so I don’t own them.
Performance details. According to Empower, the S&P 500 bounced back from it’s earlier drop and foreign stocks continued their excellent performance this year (up over 18% YTD).
Rather refreshing that international diversification is boosting my portfolio returns instead of dragging them down!
Over the last quarter, here’s a Growth of $10,000 chart courtesy of Testfolio for some of the major ETFs that shows the difference in performance in the broad indexes:
As is usually the case, just a few buy transactions to reinvest excess dividends and interest towards rebalancing the portfolio. No sell transactions at all.
I’ll share about more about the income aspect in a separate post.
Disclaimer: This story is auto-aggregated by a computer program and has not been created or edited by finopulse.
Publisher: Source link