You can always win any argument you want when it comes to the markets by changing your start and end dates.
You can really drive home your point by starting from the peak of a bull market or the bottom of a nasty crash.
It doesn’t seem like it’s even possible to perform any sleight of hand with the current cycle. U.S. large cap growth stocks — specifically tech stocks — have been outperforming everything for years now.
And now that we’re potentially setting up for an AI bubble, tech stocks feel like they are destined to keep it going.
However, I have some performance charts over various time horizons that might surprise you.
Not this one:
Value investing isn’t necessarily dead, but it has only come alive on occasion over the past 30 years or so.
This might surprise you: small-cap value — both U.S. and international — have outperformed over the past 5 years!
The international piece is the one that’s likely the most shocking here. Who knew?
Small caps have been left for dead as well.
But look at the performance of large caps, mid caps and small caps from the bottom in the mini-bear market from the trade was in April:
Small caps are outperforming coming off the lows while mid caps are more or less keeping up with the S&P 500.
This is far too short a time frame to draw any conclusions but it’s interesting to think through some possibilities here. The tech behemoths are spending an insane amount of money on capex to make AI happen.
Let’s say all of the AI productivity gains come to fruition.
Maybe the small and mid-sized companies will benefit without having to spend nearly as much at the mega cap stocks?
It’s worth considering.
Here’s another one that almost doesn’t seem real:
The Nasdaq 100 has compounded at just 8% per year this century.
That doesn’t seem to compute given the fact that the Qs have returned nearly 20% per year since the start of 2013.
So where does the 8% figure come from?
That’s because the total return for the Nasdaq 100 from 2000-2012 was -28.7% or an annual return of -2.3%. It was a lost decade and then some. This awful period included a gargantuan drawdown of 83% following the bursting of the dot-com bubble.
Starting from the peak of the dot-com bubble almost doesn’t seem fair but combining a massive bear market with a massive bull market tends to result in average-ish results.
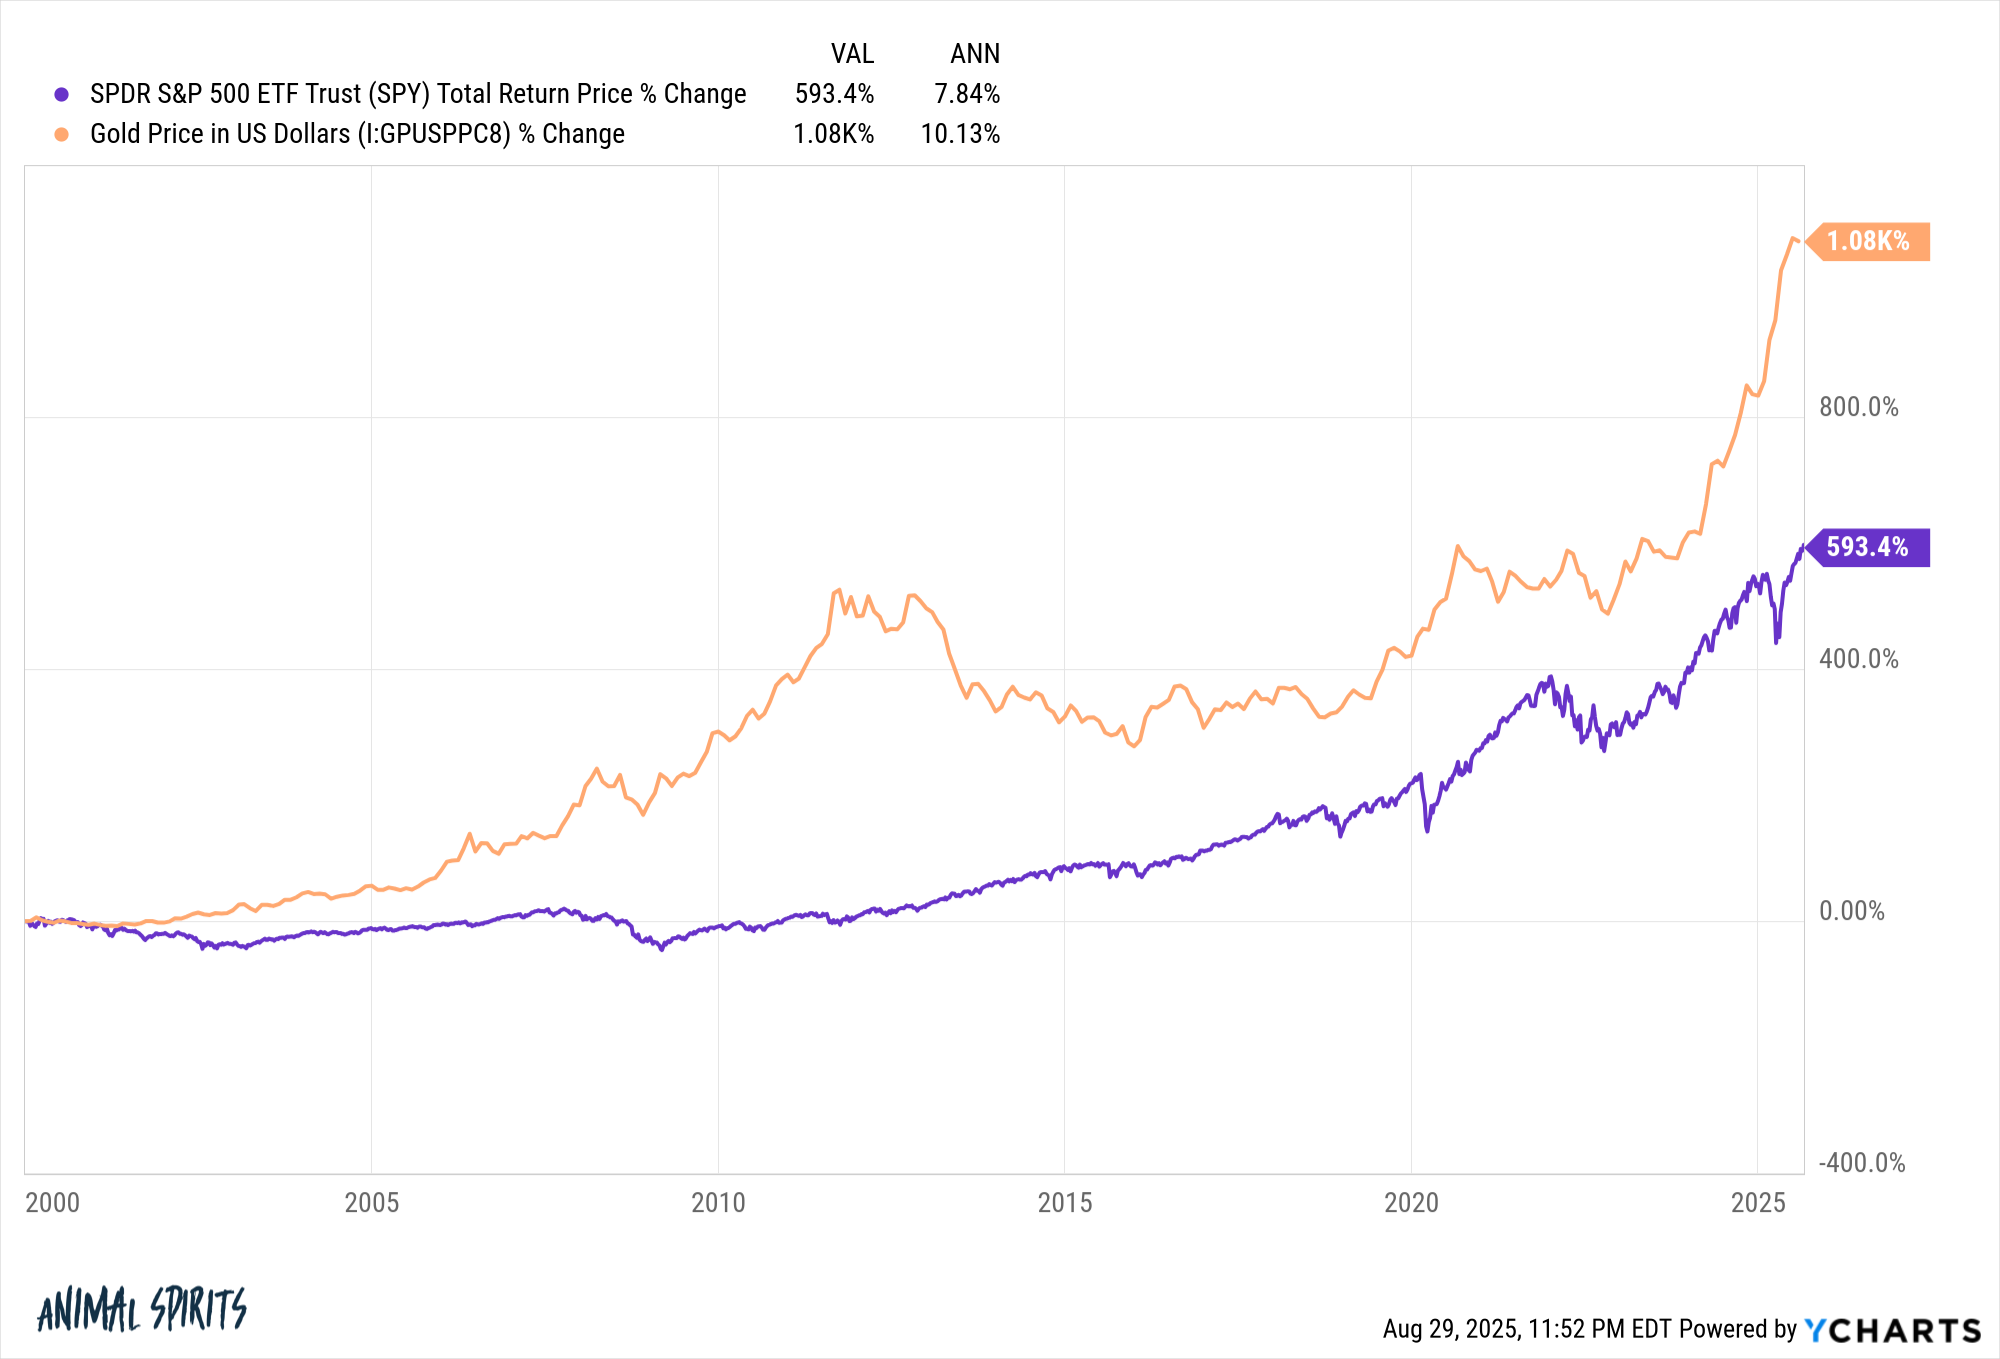
Here’s another 21st century chart that might surprise you:
Gold is handily outperforming the S&P 500 since 2000.
To be fair, gold was coming off a two-decade-long bear market while the S&P 500 was coming off a two-decade-long bull market. Timing, as they say, is everything.
Here’s one no one would have predicted coming into this year:
Almost every other country with a decent-sized economy is outperforming the U.S. stock market in 2025.
The good news is that there are no investors who time these things perfectly.
No one invests at the bottom or gets out of the top every time.
No one consistently picks the best asset classes or avoids the worst.
That’s an impossible strategy.
Managing risk requires some combination of diversification or an iron will to stick with your chosen strategy come hell or high water.
I prefer diversification, warts and all.
Further Reading:
How to Win Any Argument About the Stock Market
This content, which contains security-related opinions and/or information, is provided for informational purposes only and should not be relied upon in any manner as professional advice, or an endorsement of any practices, products or services. There can be no guarantees or assurances that the views expressed here will be applicable for any particular facts or circumstances, and should not be relied upon in any manner. You should consult your own advisers as to legal, business, tax, and other related matters concerning any investment.
The commentary in this “post” (including any related blog, podcasts, videos, and social media) reflects the personal opinions, viewpoints, and analyses of the Ritholtz Wealth Management employees providing such comments, and should not be regarded the views of Ritholtz Wealth Management LLC. or its respective affiliates or as a description of advisory services provided by Ritholtz Wealth Management or performance returns of any Ritholtz Wealth Management Investments client.
References to any securities or digital assets, or performance data, are for illustrative purposes only and do not constitute an investment recommendation or offer to provide investment advisory services. Charts and graphs provided within are for informational purposes solely and should not be relied upon when making any investment decision.
Past performance is not indicative of future results. The content speaks only as of the date indicated. Any projections, estimates, forecasts, targets, prospects, and/or opinions expressed in these materials are subject to change without notice and may differ or be contrary to opinions expressed by others.
The Compound Media, Inc., an affiliate of Ritholtz Wealth Management, receives payment from various entities for advertisements in affiliated podcasts, blogs and emails. Inclusion of such advertisements does not constitute or imply endorsement, sponsorship or recommendation thereof, or any affiliation therewith, by the Content Creator or by Ritholtz Wealth Management or any of its employees.
Investments in securities involve the risk of loss. For additional advertisement disclaimers see here: https://www.ritholtzwealth.com/advertising-disclaimers
Please see disclosures here.
Disclaimer: This story is auto-aggregated by a computer program and has not been created or edited by finopulse.
Publisher: Source link