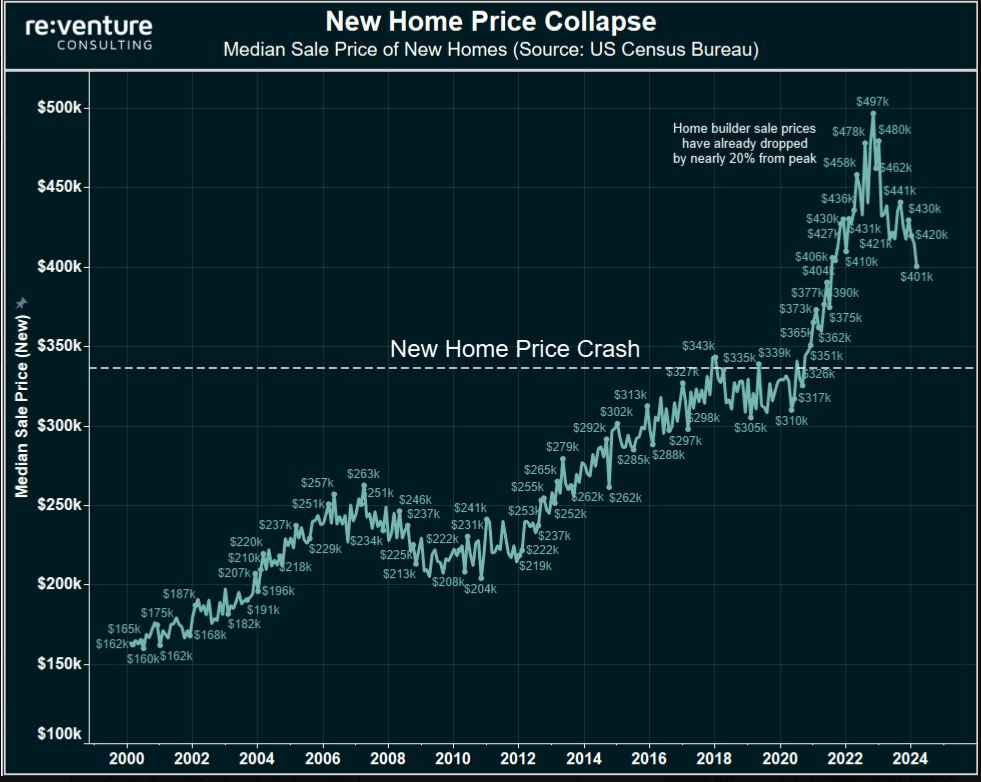
A reader sent me the following chart asking for my thoughts:
I honestly don’t know who the creator of this chart is. I don’t know the intention of it either but the fact that the title contains the word collapse makes it sound scary.
Knowing that housing prices in the U.S. are at all-time highs makes this chart seem suspect, but the data checks out. I looked at Federal Reserve data to for the median new home sales price.
It topped out at just shy of $500,000 in October 2022, while the latest reading was a hair over $400,000.
The median new home sales price is down around 20%. No lies detected just yet.
Case closed, right? Housing prices must be crashing.
Not so fast my friend.
The Washington Post recently wrote a story about how higher prices, higher mortgage rates and more first-time homebuyers are reshaping the new home market:
Some of the country’s largest publicly traded home builders have said they are rethinking their plans so they can prioritize smaller, more affordable housing. D.R. Horton, the country’s largest home builder, sold more than 82,000 homes last year, most of them under $400,000 and to first-time buyers.
Its lineup now starts at about 900 square feet.
Even Toll Brothers, known for its high-end properties with an average sales price of $1 million, is downsizing to lower-priced options, which are also faster to build. Sales of “affordable luxury” homes — starting at about $400,000 — more than doubled in the past year, outperforming more expensive properties.
Homebuilders aren’t stupid. They’re meeting demand where it resides:
The reason median prices are falling is because homebuilders are making smaller, more affordable houses.
This is a good thing!
Calling this a home price crash is disingenuous at best.
If your local brewery only sold cases of beer for $30 but then decided to sell 12-packs for $15 it doesn’t mean beer prices are crashing.
If you torture the data long enough it can tell you just about anything you want to hear. This is why it’s so important to understand how charts can be used to misrepresent data and data can be used to misrepresent charts.
One of the most important finance books ever written is How to Lie With Statistics by Darrell Huff.
It was written in the 1950s but is more relevant than ever considering the sheer amount of information we consume these days.
Huff illustrates how charts can be used to deceive depending on how they are presented.
He does this by showing an example of national income slowing but surely rising 10% over the course of 12 months. He uses three charts all with the same exact data, just presented differently.
Here’s the first chart:
The line is going up but not in an overwhelming fashion.
Here’s another look at the same data with a more truncated graph:
It’s the exact same chart but now it gives a different impression. The move looks more pronounced.
And finally the final version using an even smaller scale on the y-axis:
We’ve now gone from a steady move higher to a whopping increase.
This is why all statistics require context, nuance, explanations and a small helping of skepticism. You can’t simply take every chart you see at face value.
Huff explains:
The secret language of statistics, so appealing in a fact-minded culture, is employed to sensationalize, inflate, confuse, and oversimplify. Statistical methods and statistical terms are necessary in reporting the mass data of social and economic trends, business conditions, “opinion” polls, the census.
But without writers who use the words with honesty and understanding and readers who know what they mean, the result can only be semantic nonsense.
A picture is worth a thousand words but the words are important if you want to understand what you’re looking at.
These days, we all consume a flood of information, so it’s more important than ever to filter headlines, statistics, charts, and other visuals.
Don’t believe everything you see before you verify what it is you’re looking at.
Further Reading:
How to Buy a House in Today’s Market
Disclaimer: This story is auto-aggregated by a computer program and has not been created or edited by finopulse.
Publisher: Source link